
Hi all, it’s been a while since I last posted. I was adapting to a new country, city, friends, and workplace, focusing on observing rather than creating 🙂
Last week, I needed a correlation tool for a quick analysis while working on a task and realized I had missed studying signal processing topics. This prompted me to decide to develop a simple educational tool for signal correlation.
Let’s start with its theory.
What is Correlation?
Correlation is a way to measure how two or more things change together. If there’s a positive correlation, when one thing goes up, the other tends to go up too. If there’s a negative correlation, when one thing goes up, the other tends to go down. If there’s no correlation, the changes in one thing don’t follow any clear pattern with the changes in the other. It is a technique used in signal processing to measure how similar two signals are to each other.
In signal processing, correlation is often used to:
- Detect Patterns: Identify repeating patterns or signals within noisy data.
- Align Signals: Determine the time delay between two signals to align them properly.
- Filter Signals: Remove unwanted noise by comparing the signal to a known reference.
Cross-correlation
In the context of discrete signal processing, the correlation of two discrete-time signals ( x[n] ) and ( y[n] ) is often referred to as the cross-correlation. The cross-correlation function measures the similarity between two signals as a function of the time-lag applied to one of them. The discrete cross-correlation is given by:
![\[R_{xy}[m] = \sum_{n} x[n-m] \cdot y[n]\]](http://unalfaruk.com/wp-content/ql-cache/quicklatex.com-3c54ee99f65e83b604f3dfea80c47b7b_l3.png "Rendered by QuickLaTeX.com")
where![R_{xy}[m]](http://unalfaruk.com/wp-content/ql-cache/quicklatex.com-c57a066119449e1c8912cbd4c28a8a04_l3.png "Rendered by QuickLaTeX.com") is the cross-correlation at lag (m).
is the cross-correlation at lag (m).![x[n]](http://unalfaruk.com/wp-content/ql-cache/quicklatex.com-7678456914fac638e67ac10b23409f76_l3.png "Rendered by QuickLaTeX.com") is the first signal.
is the first signal.![y[n + m]](http://unalfaruk.com/wp-content/ql-cache/quicklatex.com-d113cbf7f30142ac447fe0c2210df2b0_l3.png "Rendered by QuickLaTeX.com") is the second signal shifted by (m) samples.
is the second signal shifted by (m) samples. is the index of the discrete-time signal.
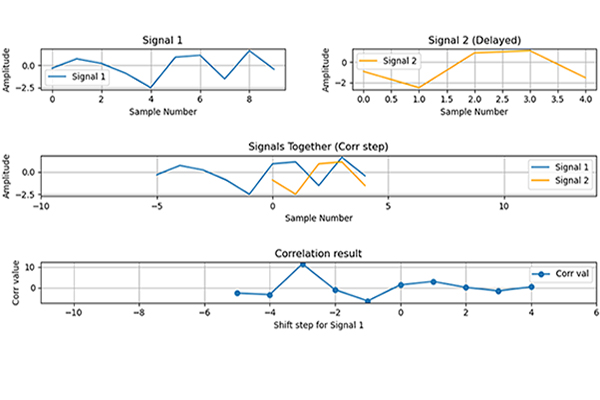
If you think this is a complex math, let me simplify it 🙂 it’s basically shifting one of the signal over the other one step by step 🙂 If you still want to see it in a visual way, here is a screen recording from my python tool:
If you’re interested in the algorithm behind of it, please take a look at:
CORRELATOR GITHUB
Please remember, this is not the best algorithm for correlation; in fact, it might be one of the worst 🙂 The main purpose of this algorithm is to demonstrate the process step by step. There are many more efficient ways to calculate the final correlation result. If you need something fast and smart, don’t use this algorithm. Use it only if you want to understand the underlying logic.
See you later, and feel free to ask your questions in the comment section.
Leave a Reply