
Hello, everyone! I’m currently working on a Python-based test tool. Actually, my main motivation is to migrate our algorithm from MATLAB to Python, which is free 🙂
I like MATLAB and its tools because they are easy to learn and use. However, I always use the version that corresponds to my license, which means that I can’t generally upgrade my code/GUI. As a result, I switched to Python, which is free and mostly effective.
The most important parameter for a test tool is the synchronization of the measurements. Because we are comparing the values for the same interval of two measurements. Since our data is digital, we have a “sampling rate” value for our measurement devices. It defines the number of samples per second (or per other units) taken from a continuous signal to make a discrete or digital signal. This value may differ if the devices are different. We obtain two arrays with different lengths for the same interval as a result of this mismatch. In the majority of cases, “interpolation” can assist us in overcoming this mismatch.
Interpolation, in a brief, is the process of determining unknown values that lie between known data points. It’s most commonly used to forecast unknown values. It is not a necessity for all scenarios, it depends on your needs. It’s possible that the sample rates of two devices will have a common period, which will enough for your needs, the developer can only utilize the values at the common period points in such case. Let me visualize it!
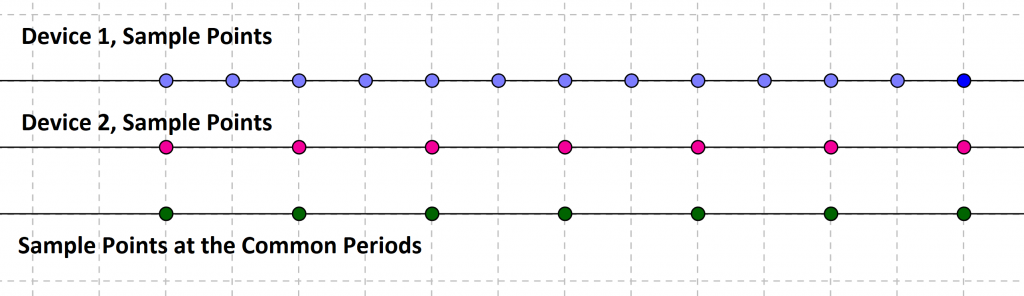
In the example above, device 1 and device 2 both have sampled values at their common period. Interpolation is not needed! Clear, and easy. Just take the values corresponding to the green dots… However, let’s look at an example that is need interpolation.
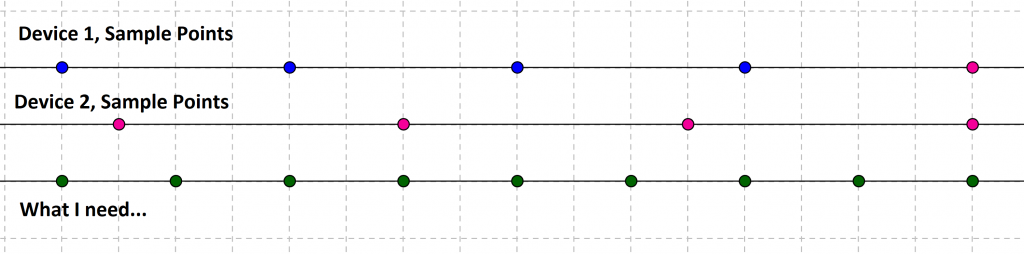
In the example above, device 1 and device 2 have different sampling rates, and their initial sample points are also not synchronized. And, the rate and location of the needed sample points are clearly different from both. Here, we need interpolation!
Let’s see the implementation. Here, two random data are generated by these code lines.
device1 = np.random.rand(96)
time1 = np.linspace(0,60,96)

device2 = np.random.rand(43)
time2 = np.linspace(0,60,43)
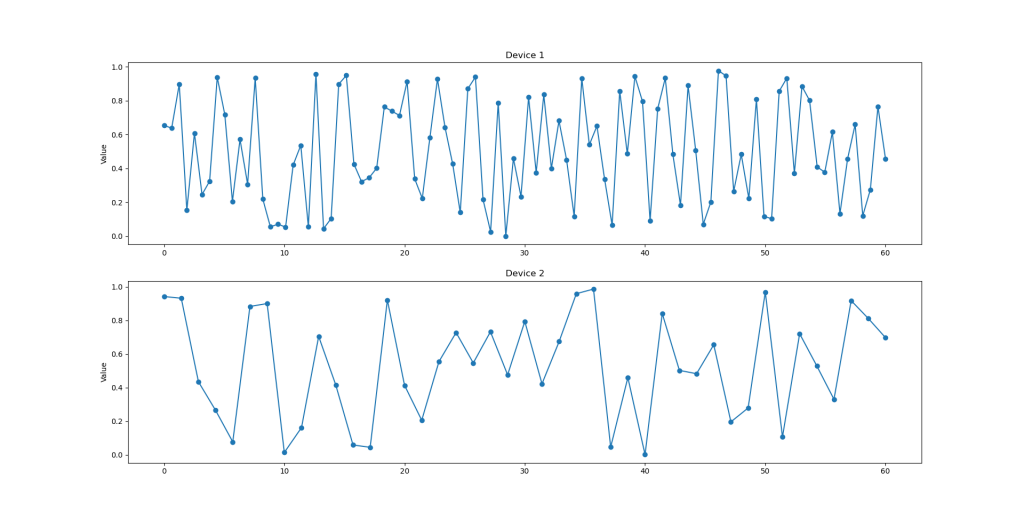
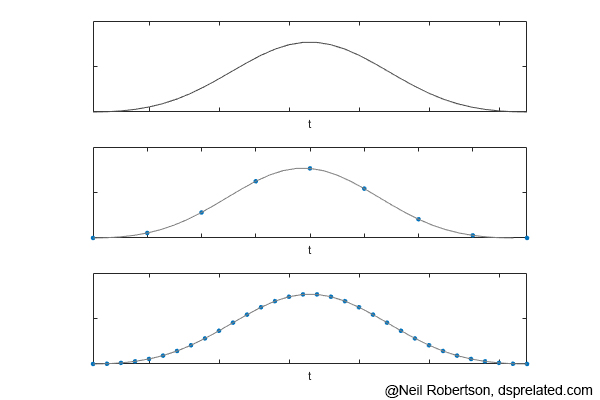
As it can be seen, Device 2 has fewer samples for the same interval. To compare the devices, I need to have values for the same epochs. To do that, I will use interpolation to get a synchronized x-axis for both.
int_device2 = np.interp(time1,time2,device2) #Interpolation for device2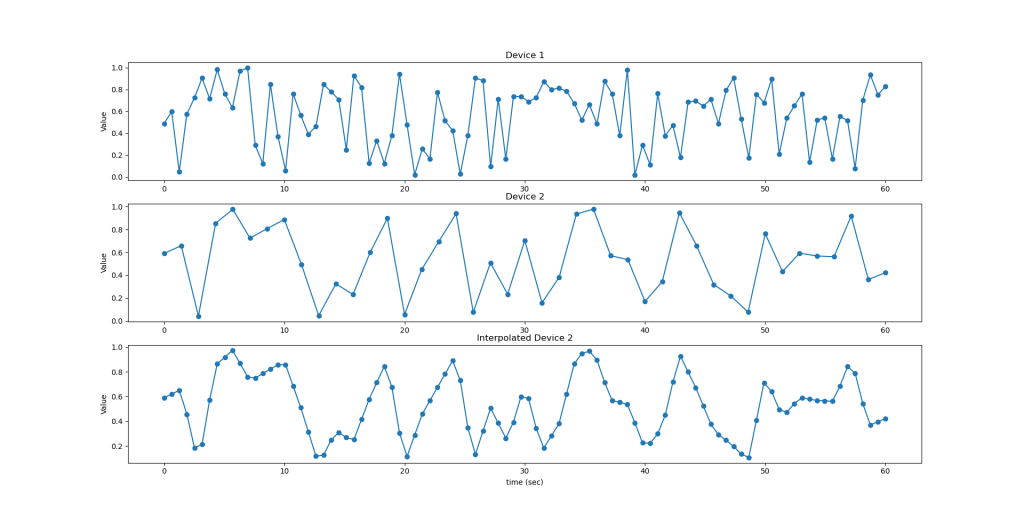
Look at the subfigure at the bottom, it is the interpolated version of Device 2. The number of sample points, illustrated as “o”, was increased. Consider the Nyquist theorem when choosing a reference for time axes (x-axes); in practice, use the axes with the most points as a reference; otherwise, you will lose some data.
Here is the whole code:
Btw, there are other methods also, for example, I know that it is also possible using “pandas” library. I’m aware that it’s already feasible to do so without a library, only math 🙂
Leave a Reply